I’ve worked in digital for twenty years, with clients like Information is Beautiful, Beyond Words, the BBC and Channel 4.
My work has involved web and app development, user experience and user-centred design, data visualisation, project management and technical leadership.
Here’s a small selection of my favourite projects from over the years.
TASO — Theory of Change Builder
TASO are a charity working across the higher education sector to help reduce equality gaps. Part of their work involves creating, and helping others create, Theories of Change — complex, evolving documents used to plan, test, and evaluate interventions.
Theories of Change are notoriously tricky: challenging even for experienced practitioners, and positively baffling for those encountering them for the first time. TASO wanted a tool that could simplify the process of creating not just Theories of Change but Enhanced ToCs with more depth and details.
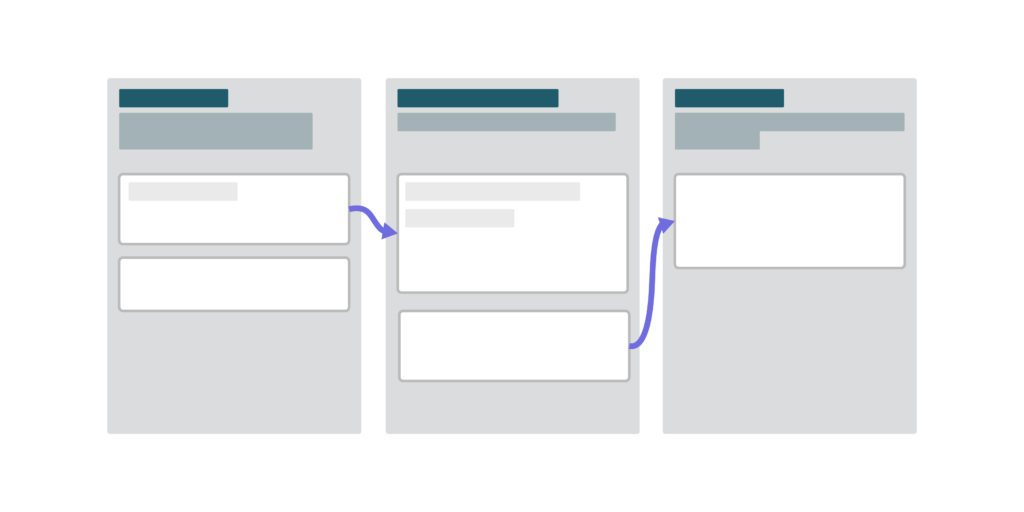
As Creative Technologist I worked with TASO from the very beginning, through research, design, development, and launch. We began with a Discovery phase, including stakeholder workshops to understand TASO’s goals, interviews and prototype testing with higher education staff to uncover the barriers people faced when trying to build a Theory of Change. The insights we uncovered shaped the approach: a guided experience that would support users, helping them learn the principles as well as making the ToC creation process more streamlined.
We took the data and knowledge we’d gathered into the Define phase, and ran a user-centered design process to turn insights into features. These features and flows came together in detailed interactive wireframes before being brought to life as designs by Adam from Creative Intervention.
Then in the Develop phase I built the tool — a full-stack build including a flexible diagram editor for creating causal models alongside a structured narrative tool that automatically extracts and synchronises content between the two — helping users focus on thinking, not formatting.
The final product was built in React and designed for longevity, with local storage for early prototypes and API-ready architecture for future integration.
The tool has been extremely well received: feedback from both users and TASO has been excellent.
Information is Beautiful — VizSweet
VizSweet by Information is Beautiful is a high-end data visualisation creation tool — think PhotoShop for data viz. As Technical Director, I led a small team of designers and developers to turn VizSweet from a pencil sketch into a fully functional web-app that’s created visualisations with tens of millions of views.
VizSweet is packed with advanced features that we scoped, wireframed and built: data-parsing and type recognition, drag-and-drop UI with deep styling options, a dynamic editing interface for each visualisation format, custom typesetting for labels across all shapes and sizes of data, customisable search and filtering widgets, and many more.
I also worked as Principal Developer on most of VizSweet’s visualisations — complex sub-apps in their own right that turn data into visual formats. Each visualisation is a project in itself, involving months of work and presenting unique challenges; some need to handle large amounts of data, others render flexible scales or labels, and others use complex layout algorithms to arrange data for any screen size.
The visualisations are built on a core of TypeScript, React and Redux, but from there modules diverge into Canvas, SVG or WebGL rendering, using a range of libraries like D3 for layouts and Jest and Playwright for testing.
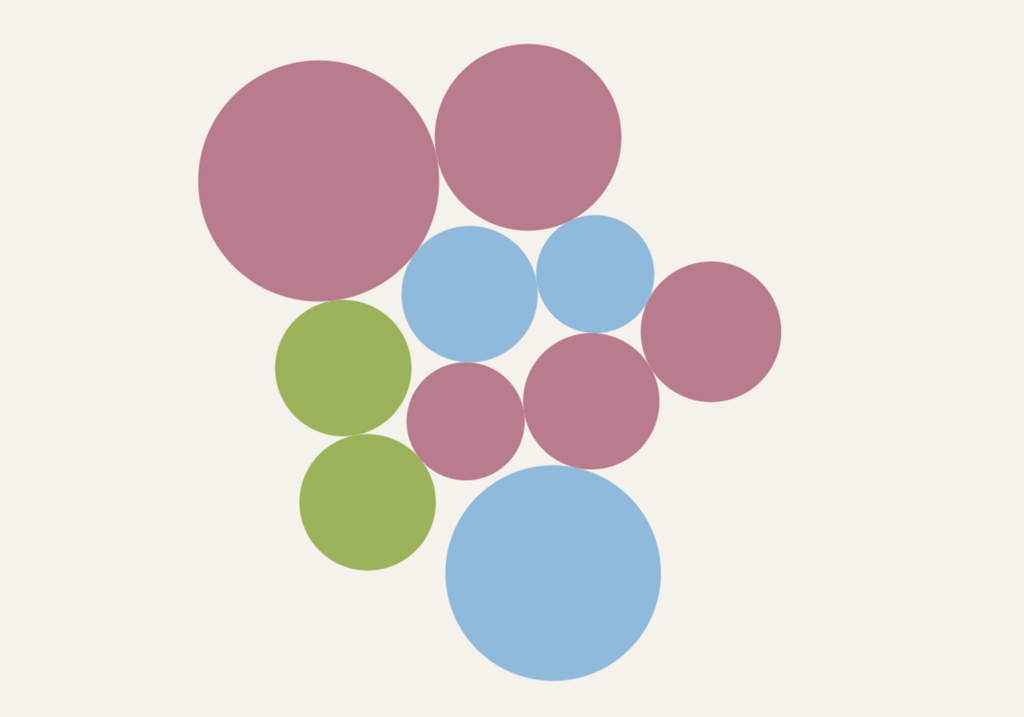
VizSweet — Tree Mappa
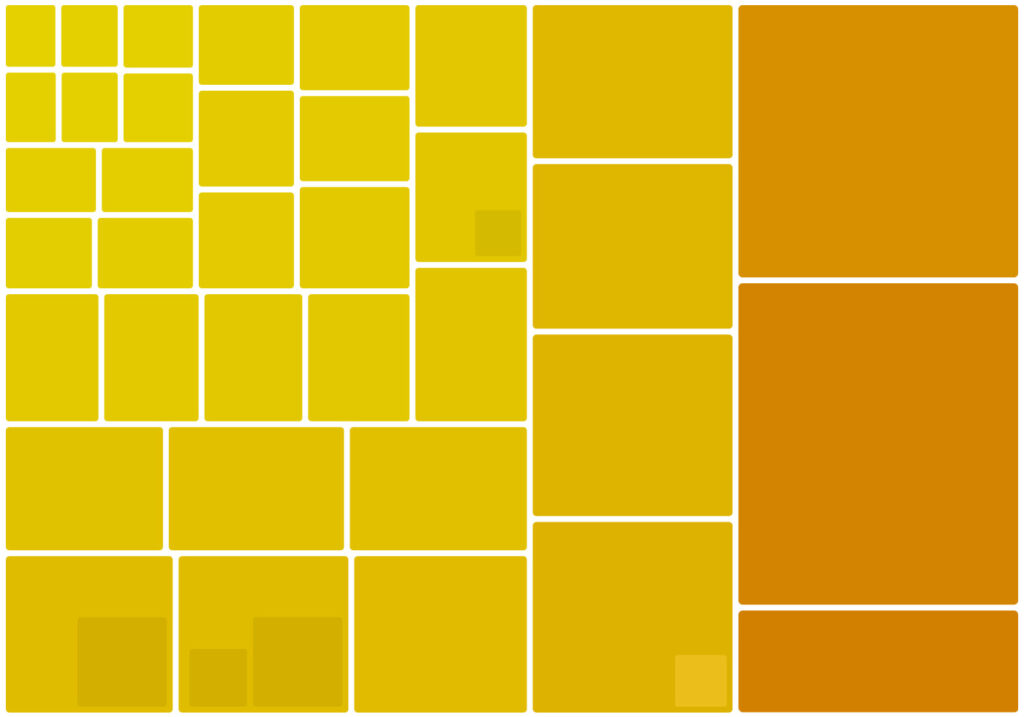
Tree Mappa is one of VizSweet’s visualisation modules — a rich sub-app within VizSweet that creates and renders tree-maps, a block-based format that’s good for displaying hierarchical data.
Some highlights include a custom layout algorithm for optimised human-readability, rich text editing, a powerful labelling system that wraps and resizes labels and fully editable, styleable UI and hierarchy parsing to handle nested data.
Here’s a small sample of the different visualisations that have been created with Tree Mappa:
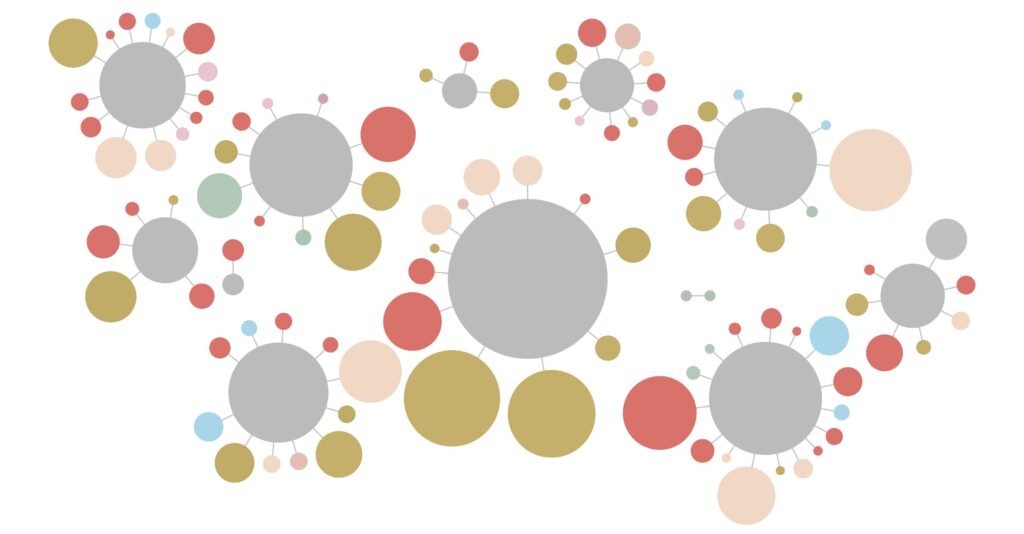
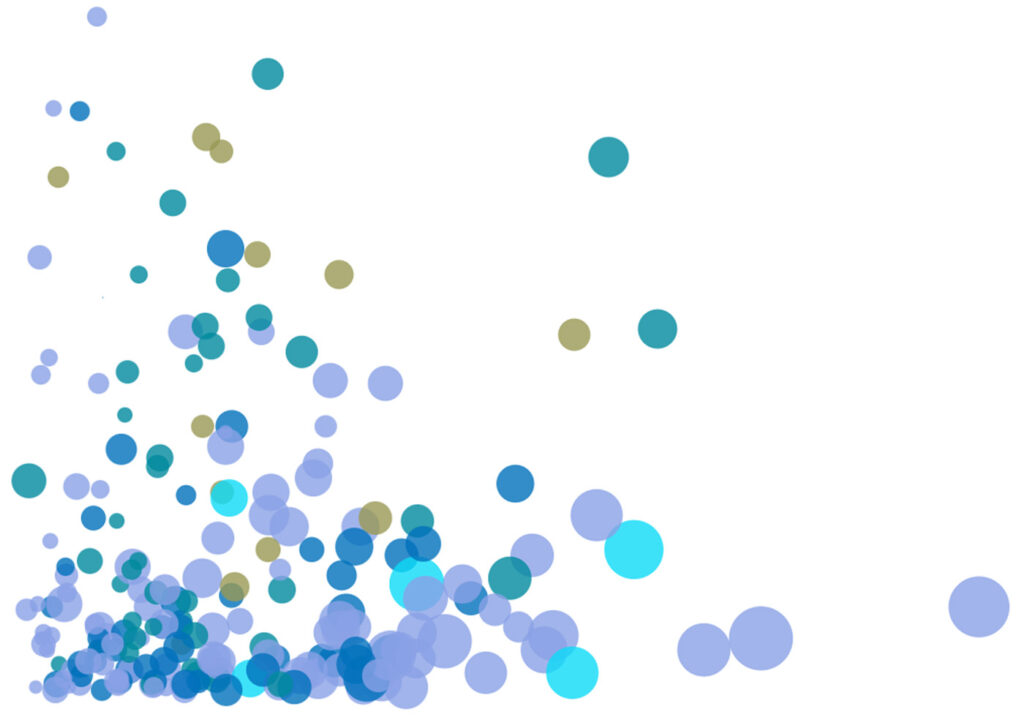
VizSweet — Balloon Race
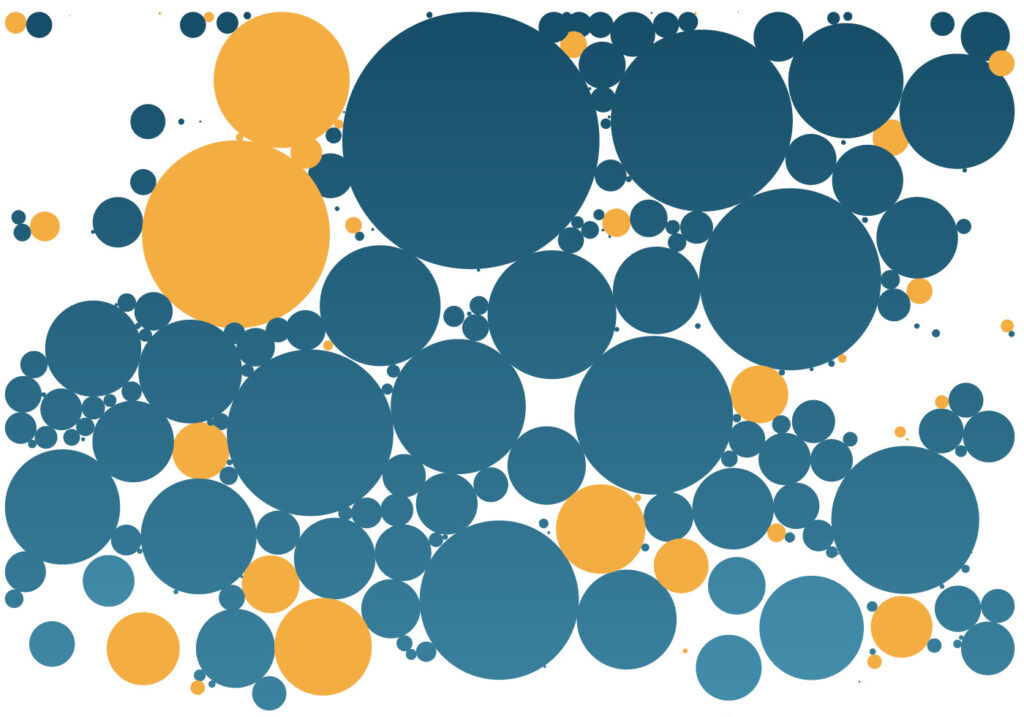
Balloon Race is a physics-based visualisation format, driven by a combination of D3’s Force Layouts and custom code. It displays data in a dynamic, fun way with customisable intro animations and nice little pops of interaction.
As with Tree Mappa, it features a huge range of deep customisation options from bubble scaling to colour palettes and axis styling.
Here’s a few of the different visualisations that have been created with Balloon Race:
VizSweet — Scatter Plot
Scatter Plot is another VizSweet visualisation, this time displaying data across two axes. It uses a combination of Three to handle large amounts using WebGL rendering and SVG to render the lines and text of the scales.
The scales in these visualisations hide a huge amount of work — they’re flexible enough to handle string, numeric or categorical data across any range, can be positioned anywhere and have endless styling possiblities.
[NDA] Public Data Project
Client: Numiko & [NDA]
Numiko were approached by a public body with years of public interest data locked away in spreadsheets. They wanted to open up the data, turning it into something accessible and useful.
I worked with Numiko to plan and develop the web-app, offering UX consultancy to plan the visualisations and wireframe the app, followed by development to actually build the thing. The app allows users to quickly sort and filter data, and includes some nifty “query building” UI that lets people easily narrow down the large data set.
The project is powered by React and Redux, and uses GSAP to provide smooth transitions between states and pages.
[NDA] Real-Time Data Project
Client: Beyond Words & [NDA]
Beyond Words were approached by a global financial client who wanted to turn their firehose of data into a real-time visualisation.
I worked on the build with a team of designers and developers, using React and D3 to create a series of visualisations that updated in real-time, smoothly incorporating the latest values with dynamic animations.
The Internet of Things
Client: Information is Beautiful & SAP
This small interactive piece is a primer on the Internet of Things — the connected network of gadgets, gizmos and widgets that’s taking over the world.
I developed the project using a combination of SVG animations and interactive, physics-driven data visualisations that combine D3 and Canvas.
User-Centred Design, UX & IA
I worked in UX for several years and did everything from user research to information architecture to wireframes — here are a few examples:
Street Summer
Client: Numiko & Channel 4
An innovative crowd-sourced YouTube-powered beatbox orchestra.
Stand Up 2 Cancer
Client: Numiko & Channel 4
Planned and wireframed the site for SU2C’s live telethon.
KS2 Art & Geography
Client: Numiko & The BBC
Researched, planned, and wireframed the BBC’s Keystage 2 Art and Geography sites.